Color-matching functions and chromaticity diagram
 12 апреля, 2014
  admin
admin Light causes different levels of excitation of the red, green, and blue cones. However, the sensation of color and luminous flux caused a particular light source varies slightly among different individuals. Furthermore, the sensation of color is, to some extent, a subjective quantity. For these reasons, The International Commission for Illumination (Commission Internationale de I’Eclairage, CIE) has standardized the measurement of color by means of color-matching functions and the chromaticity diagram (CIE, 1931).
How are color-matching functions obtained? Consider two lights lying side by side: One being monochromatic and the other one being a mixture of three primary lights with color red, green, and blue, as shown in Fig. 17.1. A human subject will be able to make the two lights appear identical (i. e. “match” them) by adjusting the relative intensities of the red, green, and blue light. The three color-matching functions are obtained from a series of such matches, in which the subject sets the intensities of the three primary lights required to match a series of monochromatic lights across the visible spectrum.
|
|
Subsequently, the measured set of color-matching functions is mathematically transformed into a new set of color-matching functions for which the green color-matching function, y (X), is chosen to be identical to the eye sensitivity function, V(X), i. e.
|
(17.1) |
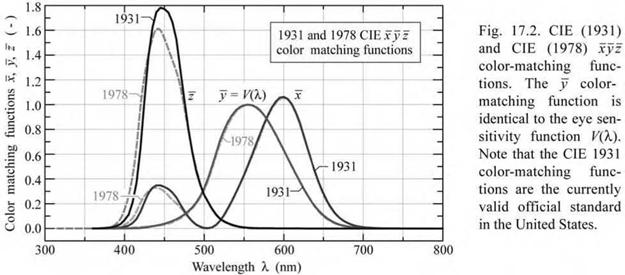
The CIE 1931 and CIE 1978 color-matching functions x(X), y(X), and z(X) are shown in Fig. 17.2. The numerical values of these color-matching functions are tabulated in Appendices 17.1 and 17.2, respectively. The three color-matching functions reflect the fact that human color vision possesses trichromacy, that is, the color of any light source can be described by just three variables. Note that x (X), y (X), and z (X) are dimensionless quantities. Also note that neither the color-matching functions nor the chromaticity diagram is unique (see, for example, Judd, 1951 or Vos, 1978). In fact there have been several different versions of the color-matching functions and of the chromaticity diagram.
|
|
For a given power-spectral density P(X), the degree of stimulation required to match the color of P(X) is given by
X = f x(X) P(X)dX J X
|
(17.2) (17.3) (17.4) |
Y = fx y (X) P(X) dX
Z = f z (X) P(X) dX
X
where X, Y, and Z are the tristimulus values that give the stimulation (i. e. power) of each of the three primary red, green, and blue lights needed to match the color of P(X). Large values of X, Y, and Z indicate red, green, and blue colors of the spectrum P(X), respectively.
Because of the distinct similarity of the three retinal-cone-sensitivity functions on one hand, and the color-matching functions on the other hand (both groups of functions have three peaks), each tristimulus value represents the approximate (but not exact) degree of stimulation that each type of retinal cone experiences when illuminated by a light source with spectrum P(X).
Inspection of Eqs. (17.2)-(17.4) suggests that the unit of the tristimulus values is “watt”. However, the tristimulus values are usually given as dimensionless quantities. The prefactor “watt -1” in front of the integral can be included so that the tristimulus values become dimensionless. If only ratios of tristimulus values are employed, as below, the prefactors and units cancel and thus become irrelevant.
The chromaticity coordinates x and y are calculated from the tristimulus values according to
|
X |
|
|
x = |
X + Y + Z |
|
У = |
|
Y X + Y + Z |
|
(17.6) |
Thus, the value of a chromaticity coordinate is the stimulation of each primary light (or of each type of retinal cone) divided by the entire stimulation (X + Y + Z). The value of the z chromaticity coordinate is calculated analogously, that is
|
Z |
|
(17.7) |
|
z = |
|
X+Y+Z |
|
= 1 - x - y |
Note that the z chromaticity value can be obtained from x and y, so that there is no new information provided by the z chromaticity coordinate. Therefore, the z coordinate is redundant
and, for this reason, does not need to be used.
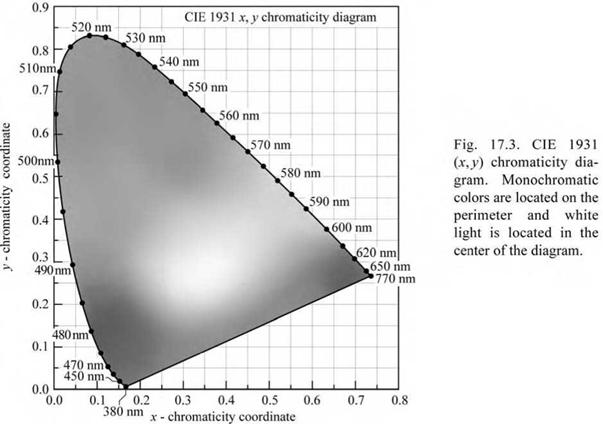
The (x, y) chromaticity diagram is shown in Fig. 17.3. Reddish and greenish colors are found for large values of x and y, respectively. Bluish colors are found for large values of z, which is, according to Eq. (17.7), for low values of x and y, or near the origin of the chromaticity diagram.
The chromaticity diagram of Fig. 17.4 shows a detailed attribution of colors to their locations in the chromaticity diagram. The assignment of colors was given by Gage et al. (1977).
|
|
An assignment of common colors in the chromaticity diagram is given in Fig. 17.5. The figure also shows the equal-energy point located in the center of the chromaticity diagram at (x, y, z) = (1/3, 1/3, 1/3). The optical spectrum corresponding to the equal-energy point has a constant spectral distribution, i. e. the optical energy per wavelength interval dA, is constant across the visible spectrum. Such a spectrum also results in equal tristimulus values, i. e. X = Y = Z.
Monochromatic or pure colors are found on the perimeter of the chromaticity diagram. White light is found in the center of the chromaticity diagram. All colors can be characterized in terms of their location in the chromaticity diagram.
|
- chromaticity coordinate |
MacAdam (1943) analyzed the color differences of closely spaced points in the chromaticity diagram. The author found that two chromaticity points must have a minimum geometrical distance to yield a perceptible difference in color. Colors within a certain small region in the chromaticity diagram appear identical to human subjects. MacAdam showed that these regions have the shape of an ellipses. Such ellipses, now known as the MacAdam ellipses, are shown in Fig. 17.6 (MacAdam, 1943, 1993; Wright, 1943). Inspection of the figure shows that ellipses in the blue and green regions are very different in size. Thus, the geometric distance between two points in the (x, y) chromaticity diagram does not scale linearly with the color difference.
|
Fig. 17.6. MacAdam ellipses plotted in the CIE 1931 (jt, y) chromaticity diagram. The axes of the ellipses are ten times their actual lengths (after MacAdam, 1943; Wright, 1943; MacAdam, 1993). |
The total number of differentiable chromaticities can be obtained by dividing the area of the chromaticity diagram through the average area of the MacAdam ellipses. This calculation yields the result that humans can discern approximately 50 000 distinct chromaticities. If possible variations in luminance (brightness) are taken into account, the number of differentiable colors increases to a value greater than 106.
In the chromaticity diagram, it is very desirable for the color difference to be proportional to the geometric difference. This has motivated the uniform chromaticity diagram. In 1960, the CIE introduced the (u, v) and in 1976 the (u', v') uniform chromaticity coordinates (Wyszecki and
Stiles, 2000). These coordinates form the uniform chromaticity diagram. The uniform chromaticity coordinates are calculated from the tristimulus values according to
|
67 |
|
u = |
|
v = |
|
X + 157 + 3 Z |
|
X + 157 + 3 Z |
|
(CIE, 1960) (17.8) |
and
|
4X |
|
97 |
|
u = |
|
v = |
|
X + 157 + 3 Z |
|
X + 157 + 3 Z |
|
(CIE, 1976) . (17.9) |
The CIE 1976 (u', v') uniform chromaticity diagram is shown in Fig. 17.7. The (u, v) and (u, v ) uniform chromaticity coordinates can be calculated from the (x, y) chromaticity coordinates according to
|
(17.10) |
|
u = u = |
4 x
— 2 x + 12 y + 3
and
|
(17.11) |
|
v = |
|
v = |
|
— 2 x + 12 y + 3 |
|
— 2 x + 12 y + 3 |
|
6 y |
Conversely, one obtains
9u' 2v'
x = ----------------------------------------- y = (17.12)
6u' - 16v' + 12 3u' - 8v' + 6
and
3u 2v (1713)
x = ----------------------------------------- y = . (17.13)
2u - 8v + 4 2u - 8v + 4
The color differences between two points in the (x, y) chromaticity diagram are spatially very non-uniform, that is, the color changes much more rapidly in one direction, e. g. the x-direction, compared with the other direction, e. g. the y-direction. This deficiency of the (x, y) chromaticity diagram is strongly reduced, although not eliminated, in the (u, v) and (u', v') uniform chromaticity diagrams. As a result, the color difference between two locations in the uniform chromaticity diagram is (approximately) directly proportional to the geometrical distance between these points.
The 1943 MacAdam ellipses in the (x, y) chromaticity diagram can be transformed to the uniform (u', v') chromaticity diagram. This transformation is shown in Fig. 17.8, which reveals that the areas of non-discernable colors are much more uniform in shape and area than the
MacAdam ellipses in the (x, y) chromaticity diagram.
Note that the transformation from the (x, y) to the (u', v') coordinate system is mathematically non-linear, and thus ellipses in the (x, y) chromaticity diagram do not transform into ellipses in
the (u, v ) coordinate system. However, if the ellipses in the (x, y) chromaticity diagram are
sufficiently small in size, non-linear distortions are small as well, so that the transformed regions are very close to ellipses.


 Опубликовано в